
This blog post explains the difference between confidence intervals that use the t-distribution and confidence intervals that use the Normal distribution. Thereby, the post will not focus on the theoretical/mathematical differences of the two distributions, but rather compare the two types of confidence intervals using simulation studies. Furthermore, in case you are interested in replicating the presented results or simply play around with it yourself, I provide the R code to conduct the simulation exercises and to replicate the figures.
In a first step, we are going the compare confidence intervals using the t-distribution to confidence intervals using the normal distribution. We will assume that we know the underlying data generating process and examine what happens to the intervals if the number of observations increase. That is, we will examine how the two confidence intervals depend on the sample size. In a second step, we investigate how often a confidence interval does not include the true mean. Once again, we will repeat this exercise for different sample sizes. Finally, we are going to examine how often an interval does not include the mean of another sample drawn from the same distribution. This is particularly important for mean testing. Also in this case we will vary the number of observations.
Normal vs. t-Distribution
In this first part, we are going to compare confidence intervals using the t-distribution to confidence intervals using the normal distribution. Particularly, we will see how the confidence intervals differ between the two distributions depending on the sample size. We will use the standard formula to construct confidence intervals (see below) and work with two parameters. First, we are going to change n, i.e. the number of observations. We let n run from 2 to 100. That is, we will compute 99 confidence intervals for n=2 to n=100. Second, we will do this twice, once using Z values, i.e. using the Normal distribution, and once using t values, i.e. using the t-distribution.


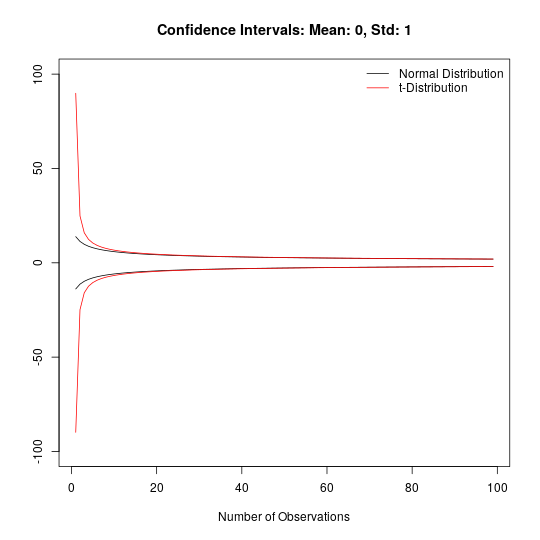
The figure below plots the resulting confidence intervals. The red line depicts confidence intervals from the t-distribution and the black line depicts the corresponding intervals from the normal distribution. We assume the we know the underlying data generating process (DGP) and that it is the same for all cases. Thereby, we assume a Standard Normal distribution, i.e. mean is zero and standard deviation is one.
One can easily see that the t-distribution gives much larger intervals when the number of observations is small. However, pretty soon, the two confidence intervals converge.
Excluding True Mean
In a second step, we are going to conduct a simulation study. This study will help us to find out, how often confidence intervals of random variables do not include the true mean.
In our case, we chose the data generating process to be normally distributed with mean zero and variance one. Hence, the true mean of our data generating process will be zero. Thus, we are going to examine how often confidence intervals do not include zero.
How are we going to do that?
- Draw a vector of length 2
- Construct a 95% confidence intervals using Normal distribution
- Construct a 95% confidence intervals using t-distribution
- Check if the intervals include zero
- Repeat point 1-4 10.000 times
- Compute how often a confidence interval does not include zero on average
- Repeat point 1-6 for an increasing vector length. That is, we repeat the simulation for vector length 3 to 100.
In case you are having trouble following the exact steps of the simulation study, you can check the R code.
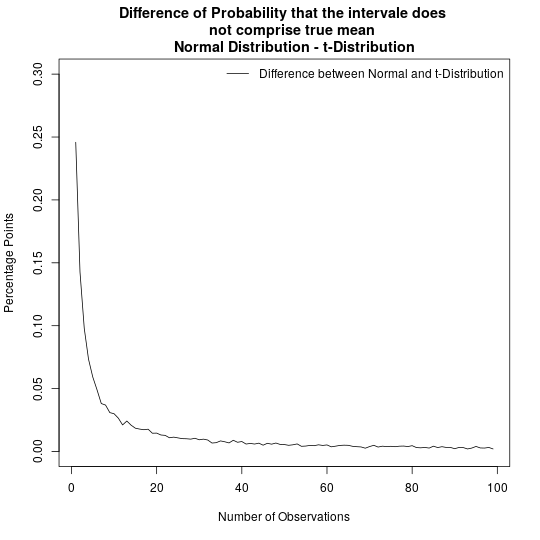
The following figure plots visualizes the results of this simulation study. The figure shows the share of confidence intervals that do not include zero, i.e. the true mean of the DGP, depending on the vector size. The black line shows refers to confidence intervals using the normal distribution and the red line refers to confidence intervals using the t-distribution. The figure illustrates that the share of confidence intervals that do not include the true mean is larger for confidence intervals based on the normal distribution than for confidence intervals based on the t-distribution. The difference is especially pronounced when having only few observations.

The following figure plots the difference between the share of confidence intervals not including the true mean when using the normal distribution and the share of confidence intervals not including the true mean when using the t-distribution. That is, the following figure plots the difference between the black line and the red line of the figure above. It states much more often confidence intervals based on the normal distribution does not include the true mean.
Excluding Mean from different sample
The last part of this post will focus on mean testing. It is quite common that one uses mean tests to examine if the mean of two variables are statistically different from each other. We will once again conduct a simulation study and we will see that, especially when working with few observations, the choice of the underlying distribution will make a considerable difference.
How is the simulation exercise construct?
- Draw a vector of length 2
- Construct a 95% confidence intervals using Normal distribution
- Construct a 95% confidence intervals using t-distribution
- Draw a second vector of length 2 and compute its mean
- Check if the intervals include the mean
- Repeat point 1-5 10.000 times
- Compute how often a confidence interval does not the mean on average
- Repeat point 1-7 for an increasing vector length. That is, we repeat the simulation for vector length 3 to 100.
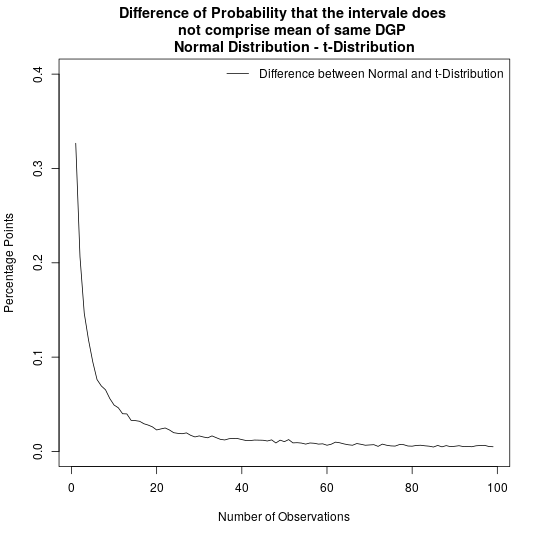
In a similar fashion as above, the following figure shows the share of confidence intervals that do not include the mean of a second random variable that is drawn from the same data generating process. Once again, for very few observations, confidence intervals that are based on the t distribution do a much better job than confidence intervals that are based on the normal distribution. Surprisingly, the difference between the two types of confidence intervals does not collapse to zero immediately, as it was the case in the previous exercises, but remains visible even at a vector length of 100.

This post focused on difference of confidence intervals that are based on the normal distribution and confidence intervals that are based on the t distribution. Conducting simulation exercises, I showed that when having very little observations, one is definitively better off using the t-distribution. In comparison to confidence intervals that are based on the t-distribution, confidence intervals that are based on the normal distribution fail much more often to include the true mean of a distribution. Thus, using the t-distribution for testing appear the much more conservative option.

2 thoughts on “What is the difference between using the t-distribution and the Normal distribution when constructing confidence intervals?”