
The package ‘Seasonal’ facilitates seasonal adjustment in R. The R package provides an easy-to-handle wrapper around the X-13ARIMA-SEATS Fortran libraries provided by the US Census Bureau. X-13ARIMA-SEATS is the state-of-the-art seasonal adjustment software produced, distributed, and maintained by the Census Bureau. The software permits extensive time series modeling and model selection capabilities for linear regression models with ARIMA errors (regARIMA models). Futhermore, the software has the capability to generate ARIMA model-based seasonal adjustment using a version of the SEATS procedure originally developed by Victor Gómez and Agustín Maravall at the Bank of Spain as well as nonparametric adjustments from the X-11 procedure. Finally, the program allows diagnostics of the quality and stability of the adjustments achieved under the options selected as well as the ability to efficiently process many series at once. The R package ‘Seasonal’ allows the user to access this software directly from R.
The following tutorial demonstrates how to seasonally adjust a time series in R using the ‘Seasonal’ package. For this purpose we use a R dataset called ‘AirPassengers’. This dataset contains the classic Box & Jenkins airline data. That is, the dataset contain the monthly totals of international airline passengers from 1949 to 1960. The data entail a high degree of seasonality, which become apparent when looking at the figure below. 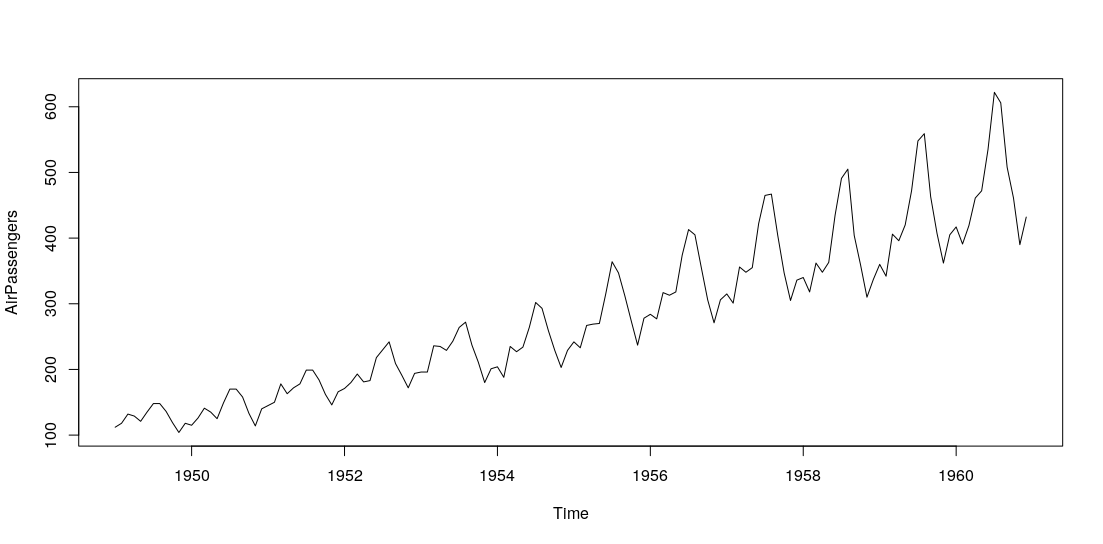
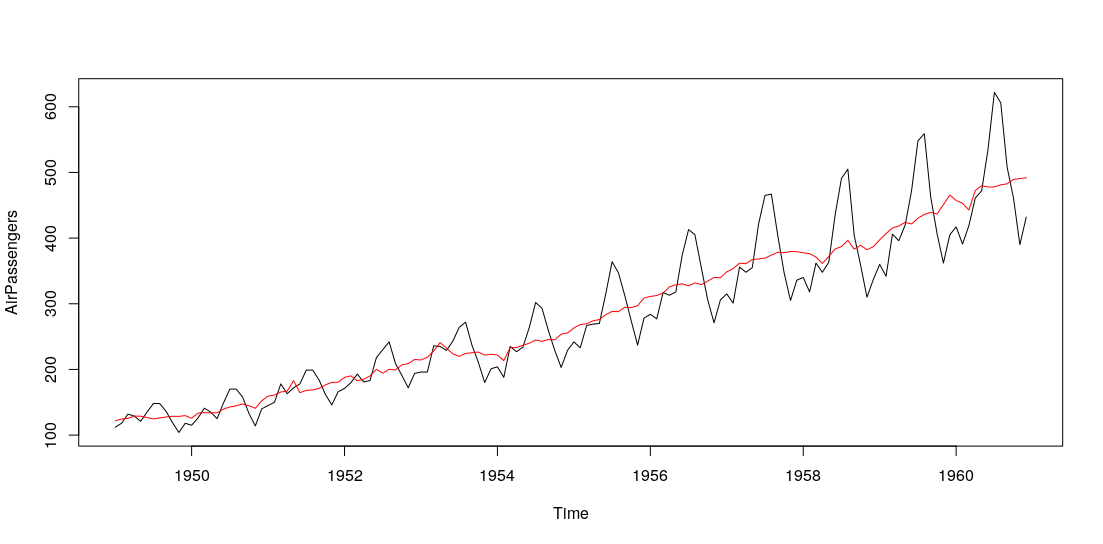
Seasonal fluctuations make it difficult to interpret monthly changes of time series, i.e. it becomes difficult to determine how much of the change in a time series is due to fundamentals and how much of the change is due to seasonal factors. The seasonal adjustment procedure corrects the data for seasonal factors and produces data that are free of any seasonal influence. After seasonally adjusting data, we are now able to interpret monthly changes in the data and attribute this changes to fundamentals. The following figure displays both, the original series as well as the seasonally adjusted series. Note that the seasonally adjusted series in red is much smoother than the original. You can find the R code that seasonally adjusts data and produces these figures at the end of the post.
The following R code seasonally adjust the AirPassanger data and reproduces the figures included in this post.
# start with an empty workspace
rm(list=ls())


# install and load seasonal package
# install.packages("seasonal")
library(seasonal)


# use the R dataset AirPassengers. This dataset
# contains the classic Box & Jenkins airline data.
# Monthly totals of international airline
# passengers, from 1949 to 1960.
plot(AirPassengers)


# seasonal adjust time series using X11.
sa_series <- seas(AirPassengers,x11 = "")


# plot original and seasonally adjusted series.
plot(AirPassengers)
lines(final(sa_series),col=2)

Hi, I’ve got a short question. I would like to seasonally adjust some inflation time-series via the following command: cpi <- final(seas(as.ts(naWindow(inflation),freq=4))), however this leads to an error ' Path specified but does not exists. Error in checkX13(fail = TRUE, fullcheck = FALSE, htmlcheck = FALSE)' – Any idea how to resolve this?
Hey Sean
There seems to be a problem with the installation of the seasonal package. The package requires the Fortran libraries from the US census bureau. Usually, when one installs the package the libraries are downloaded automatically. However, this does not always work due to firewall or other restrictions. If this is the case, you can download the library directly from the us census bureau , the package allows you to specify the path where you save the library. Nevertheless, given your comments I suspect that something went wrong with the installation of your package. Remove the package and install it again. However, this time specify the proper path to your R package library and do not use some temp folder. I guess it should work then. Let me know if it still does not work.
Cheers, ad
Hi, I’ve got a short question regarding seasonal adjustment of an inflation time-series.
Using the code cpi <- final(seas(as.ts(naWindow(inflation),freq=4))) leads to the error:
Path '/var/folders/qn/syx5z5tj4s5075wwmrrd3hbr0000gn/T//RtmpXhtpLw/downloaded_packages' specified but does not exists.
Error in checkX13(fail = TRUE, fullcheck = FALSE, htmlcheck = FALSE)
However, previously I have specified:
if (!require("seasonal")) {install.packages("seasonal"); library('seasonal')}
Any idea what is going wrong?
Hey Sean
There seems to be a problem with the installation of the seasonal package. The package requires the Fortran libraries from the US census bureau. Usually, when one installs the package the libraries are downloaded automatically. However, this does not always work due to firewall or other restrictions. If this is the case, you can download the library directly from the us census bureau , the package allows you to specify the path where you save the library. Nevertheless, given your comments I suspect that something went wrong with the installation of your package. Remove the package and install it again. However, this time specify the proper path to your R package library and do not use some temp folder. I guess it should work then. Let me know if it still does not work.
Cheers, ad
Hi Ad,
First of all, thank you for taking the time to answer this question. The strange thing is that previously, with different data, I did not get this error. Now I am trying to apply this methodology to a different data set and all of a sudden it didn’t work. Nevertheless, problems are there to solve. If I type library(), I still see the x13binary in there. I cannot really tell if there is a firewall blocking anything (I am working on an Apple device). How do you suggest that I adapt the code such that the package is properly installed and called when necessary?
Best,
Sean
Hi Sean,
That is interesting indeed. So your code already worked once and then it stopped working? This could be due to installing the package into a temporary folder. Generally, as all R packages, you only need to install your seasonal package once. Install it the following way: install.packages(“seasonal”,lib = “specify path to your library”). Once you successfully installed the package load it with require(“seasonal”). This should work. Let me know if otherwise.
Best, ad
Hmm. I’ve tried to run the same code on a different computer, and now I get a different error as well. The list of errors:
Errors:
– Problem reading /var/folders/0g/4mh5dg_n3hn9jwhtdv5gcd840000gn/T//RtmpQ461Wz/x1394f1cee4af4/data.dta.
Check your input file and format.
– Time series could not be read due to previously found errors
– Specify series before user-defined adjustments
– Need to specify a series to identify outliers
No clue, what is going wrong.
These were the prior steps:
inflation.file <- "rawData/germany_inflation.csv"
inflation.data <- read.table(inflation.file, skip = 1, header = F, sep = ',', stringsAsFactors = F)
inflation <- tis(inflation.data, start = inflation.start, tif = 'quarterly')
Before applying the seasonal adjustment as in:
cpi <- final(seas(as.ts(naWindow(inflation),freq=4)))
Hi again,
Did you mange to resolve the problem? It seems that R tries to find a STATA (?) file in your temporary folder. I am really not sure what you are doing. Could you provide a reproducible example?
Best, ad
Goodmorning Ad,
Unfortunately I did not yet resolve the issue. Basically, the package is installed; it is situated in the library; checkX13() indicates that the path is specified, but does not exist; x13binary::checkX13binary() indicates that x13binary is working properly. One of the suggestions of R is to set the path manually via:
Sys.setenv(X13_PATH = “YOUR_X13_DIRECTORY”)
To discover the x13 directory, I typed checkx13(). However, then I re-run the lines of code and get the exact same issue ;-(.
PS. Is there maybe another way of communicating, otherwise the line of comments will increase and increase.
Hi,
it really looks to me like an installation error. Does my short example work for you?
Best, ad
What should I put in the ”specify path to your library”?
What I have done is used .Library and set the path to “/Library/Frameworks/R.framework/Resources/library”, then I put require(“seasonal”) into my code. Nevertheless, I still get the same error. So now I am guessing that the input is somehow incorrect, could this be possible?
This one: cpi <- final(seas(as.ts(naWindow(inflation),freq=4)))
Sorry for not being clear, I was talking about the example on my blog. If it does not work, then you know that it is your installation.
Hi Ad,
OK. An installation problem is easily solvable. Just wanted to be sure that the code itself is not wrong, and that also the input, as.ts(naWindow(inflation), freq = 4), is the correct input format.
Best,
Sean
How to remove the outliers from the de -seasonalised data?
There is an option that one can set. You should check the vignett of the package.
I tried your code on a10 series from fpp2 package and final(a10) is producing following error
Error in x$data : $ operator is invalid for atomic vectors
Here’s my code:
library(fpp2)
library(seasonal)
?seas
# seasonal adjust time series
sa_series <- seas(a10)
# plot original and seasonally adjusted series.
plot(a10)
lines(final(a10), col=2) # Not working so I tried print final(a10) and got the same error.
Okay got my error. Shouldn’t have posted in a hurry.
The code should be
final(sa_series)
My bad! used wrong object name.
No worries, happens to me all the time 🙂 Thanks for reaching out anyways!!