
A Venn diagram (also sometimes also called primary diagram or set diagram) is a diagram that depicts all possible logical relations between a collection of sets. Certain subjects, such as omitted variable bias, can be best be explained by using a Venn diagram. This post shows how to construct a Venn diagram in R.
The following code produces the Venn diagram used in the post explaining the omitted variable bias.
# start with an empty workspace
rm(list = ls())
# load EulerR pkg
library(eulerr)
# create sets
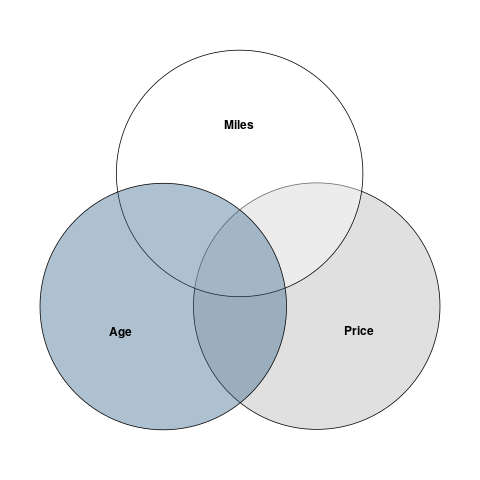
fit <- euler(c(Price = 500, Miles = 500, Age= 500,
"Price&Miles" = 200,
"Price&Age" = 200,
"Miles&Age" = 200))
png(filename="venn.png")
plot(fit, fill_opacity = 0.3)
dev.off()
The code produces the following Venn diagram:

One thought on “Create Venn-Diagram in R”